EUR/USD 1H

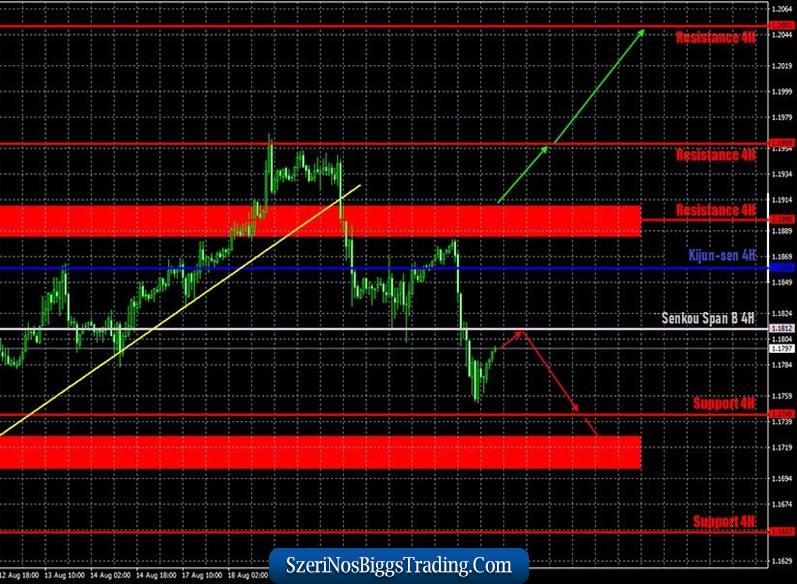
The euro/dollar turned around the resistance area of 1.1886-1.1910 and resumed its downward movement, overcoming an important and strong Senkou Span B line on the hourly timeframe on August 21. It began a rising correction by the end of the day, which may continue in the first trading day of the new week. But the price rebound from the Senkou Span B line may provoke a resumption of the downward movement.
However, the bears are waiting for an equally strong support area of 1.1702-1.1727, which is not just a support area, but also an area that the price cannot overcome since July 27. During this time, the quotes of the euro/dollar pair tested it five times from the top and each time the attempt to overcome it was unsuccessful. Therefore, before overcoming this area, we believe that the prospects for the US currency are very dim.
EUR/USD 15M

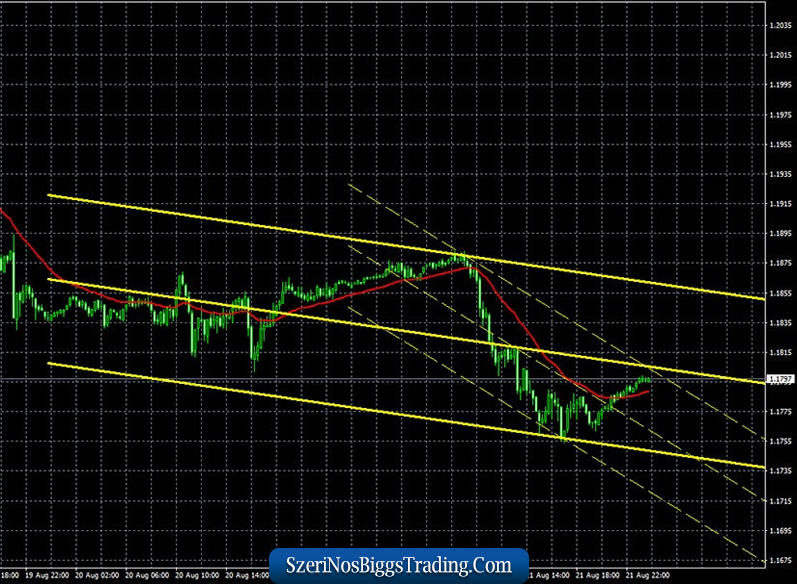
Both linear regression channels are directed downwards on the 15-minute timeframe, but the support area of 1.1702-1.1727 is more important now. Last Friday, a new Commitment of Traders (COT) report was released.
According to this report, non-commercial traders behaved very calmly during the reporting week (August 12-18). In total, the “non-commercial” category of traders, which is considered the most important, closed 4,500 Buy-contracts and the same number of Sell-contracts during this period. Thus, the net position for this category of professional players remained unchanged. And along with it, the mood of traders has not changed. Thus, the COT report still does not give any reason to assume that forming an upward trend has been completed.
Even if we take into account the fact that the pair fell by 200 points between August 19 and 21, this still does not change anything. During the current upward trend, which has been forming for three months, the pair has already fallen by 200 points. This value continues to be extremely small, as the overall growth of the pair over this period was about 1200 points. Thus, it is difficult to call 200 points of decline even a correction. Therefore, even taking into account the fact that the last three trading days were not included in the COT report, we still can not expect a sharp change of mood from non-commercial traders.
The fundamental background for the EUR/USD pair was quite interesting last Friday, however, technical factors still ruled the ball on the currency market, and not macroeconomic data. We should note that business activity in the services and manufacturing sectors of the EU countries began to decline and reached the lowest positive levels – just above 50.0. Traders may witness lower values in the next month, and in the meantime, fairly high levels of coronavirus are reported again in France and Spain.
It’s time to talk about the second wave. If the situation does not improve in the near future, the European Union will face new problems of both epidemiological and economic nature, which, in turn, may negatively affect the euro’s exchange rate and allow the dollar to finally go below $1.17.
Based on the above, we have two trading ideas for August 24:
1) Bulls have temporarily abandoned new purchases of the euro and continue to take profits on previously opened trades. The pair has already dropped below the Senkou Span B line and may continue to fall. Thus, in order for the upward trend to resume, the quotes must return to the area above the 1.1886-1.1910 range. In this case, we will recommend buying the euro again with targets at the levels of 1.1958 and 1.2051. Take Profit in this case will be from 40 to 120 points.
2) Bears finally seized the initiative in the market and began to pull the pair down. However, a lot depends on the bulls, which simply closed part of the longs. Nevertheless, we recommend selling the pair while aiming for the support level of 1.1745 and the support area of 1.1702-1.1727, as traders managed to overcome the Senkou Span B line (1.1812). Potential Take Profit in this case will be from 40 to 80 points.
Hot forecast and trading signals for the GBP/USD pair.
We recommend that you also explore the fundamental background in these articles:
Overview of the EUR/USD pair. August 24. “Four American Crises” continue to keep buyers of the dollar at bay.
Review of the GBP/USD pair. August 24. Which should have been proven: Brexit talks have failed. Brussels tries to revive the “dead horse”. British pound hit by a storm
Explanations for illustrations:
Support and Resistance Levels are the levels that serve as targets when buying or selling the pair. You can place Take Profit near these levels.
Kijun-sen and Senkou Span B lines are lines of the Ichimoku indicator transferred to the hourly timeframe from the 4-hour one.
Support and resistance areas are areas from which the price has repeatedly rebounded off.
Yellow lines are trend lines, trend channels and any other technical patterns.
*The market analysis posted here is meant to increase your awareness, but not to give instructions to make a trade.
If you have an interest in any area of Forex Trading, this is where you want to be.
Global Fx Trading Group is a world leader in providing Fx services to individual traders, including: Unmatched funding programs, on-line education, virtual trading rooms, automation tools, robot building, and personal coaching.
The company was first established by Jeff Wecker, former member of the Chicago Board of Trade, with 25 years in the industry. Jeff has a keen understanding of the needs of Forex traders and those needs are our focus.
Please join our VIP Group while is still FREE …
https://t.me/joinchat/JqsXFBKpyj3YS4bLWzT_rg
Our mission is simple: To enhance as many lives as we can through education and empowerment.
#theforexarmy #forexsigns #forexsignals #forexfamily #forexgroup #forexhelp #forexcourse #forextrade #forexdaily #forexmoney #forexentourage #forextrading #forex #forexhelptrading #forexscalping #babypips #forexfactory #forexlife #forextrader #financialfreedom

