GBP/USD 1H

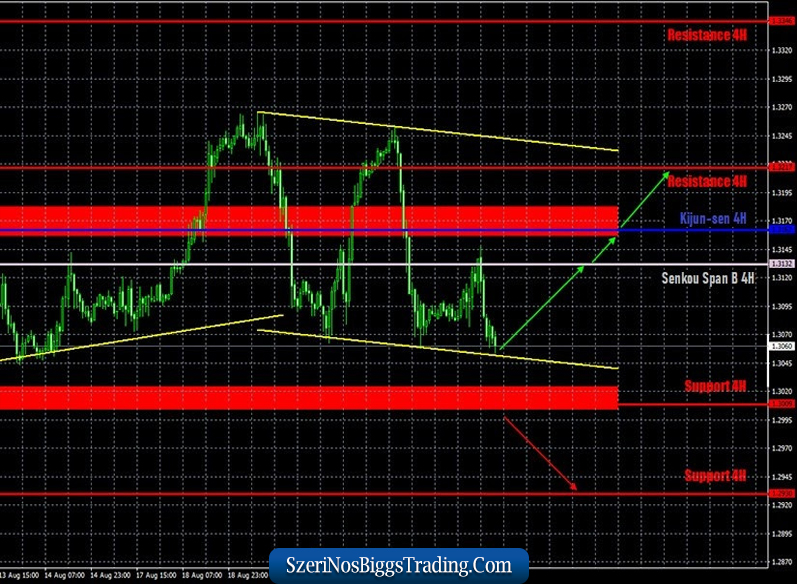
The GBP/USD pair tried to start a new round of upward movement and even crossed the Senkou Span B line on August 24, however, the bulls did not want to re-invest in the pound sterling and the downward movement quickly and abruptly resumed. A new downward trend channel was formed yesterday, which looks more like a sideways channel, but still has a slight downward trend.
The pair’s quotes are now trading near its lower border. Thus, there can be two ways out of the current situation. Either the bears will manage to break through the lower line of this channel, then the chances for continuing the downward movement will significantly increase, or the attempt to overcome it will be unsuccessful, then it will be quite possible to expect the pound to grow, at least to the critical line.
GBP/USD 15M

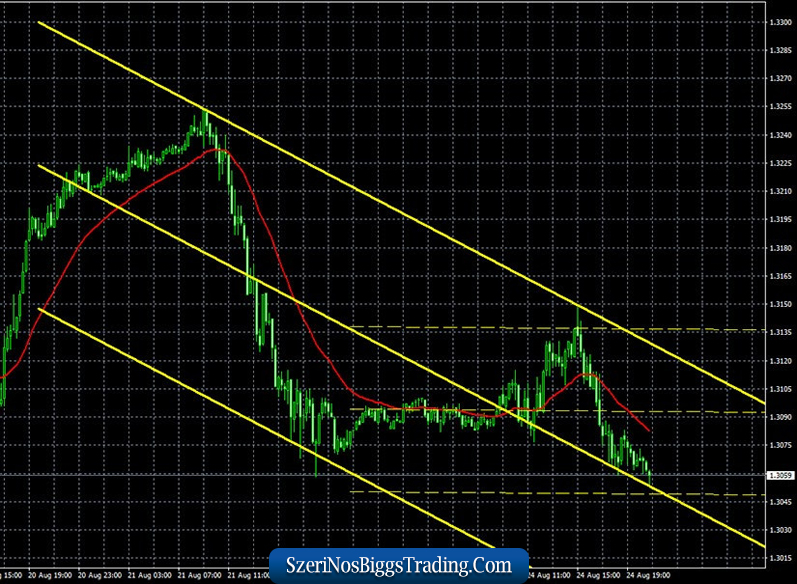
The lower linear regression channel turned sideways on the 15-minute timeframe, but the downward movement has resumed, so the channel may turn down again soon. The latest Commitments of Traders (COT) report for the British pound, which came out on Friday, was quite predictable. Non-commercial traders reopened 5,880 Buy-contracts units and closed 2,232 Sell-contracts in the period from August 12 to 18.
Thus, the net position for this category of traders has grown again, by as much as 8,000 contracts, which is a lot for the pound. Actually, the pound continued to grow against the dollar until August 18 inclusive, so the COT report accurately reflected what was happening on the market at that time. But even the remaining three days of the week, which were not included in the COT report, do not suggest that the mood of professional traders has changed or will change in the near future.
The pound was thrown from side to side, by more than 200 points, and then it could not go down again. The British currency failed to update the previous week’s lows on Monday. Therefore, it is quite possible to expect that the upward trend will continue, at least until we receive additional technical signals to continue the downward movement. By the way, take note that thanks to the last reporting week, the “non-commercial” category now has more Buy-contracts than Sell-contracts (52,000 versus 49,000).
The fundamental background for the GBP/USD pair was flat on Monday. Markets quickly digested the information that the next round of talks between Brussels and London failed. And there is no other important news at this time. The British currency seems to have begun to fall in price in recent days, but sellers clearly need help in this process. And it is not known when help will come. In theory, the British pound needs a little help to continue falling against the dollar. Because all the negativity in the UK is still there.
Accordingly, Brexit alone without a deal with the EU and a serious contraction of the British economy should be enough to move down by at least 400-500 points. Moreover, the pound is now clearly overbought. Only complete uncertainty in the future of the US economy is holding back traders from new purchases of the dollar. It is unclear who will win the election, what kind of relationship will be with China, and how quickly the American economy will recover.
There are two main options for the development of events as of August 25:
1) Buyers continue to gain strength and are taking a rest. However, they can be active at any moment. For example, in case of an unsuccessful attempt to overcome the lower channel line, a rebound up to the Senkou Span B line may follow. However, you are advised to open long positions if the Kijun-sen line (1.3162) has crossed with the target of the upper channel line. Take Profit in this case will be up to 60 points.
2) Bears are trying to dominate again, but the bulls, as well as the lower channel line, do not let them go far down. If sellers manage to overcome the lower channel line, then it will be possible to open shorts with targets at the support levels of 1.3009 and 1.2930. Take Profit in this case will be from 30 to 100 points.
Explanations for illustrations:
Support and Resistance Levels are the levels that serve as targets when buying or selling the pair. You can place Take Profit near these levels.
Kijun-sen and Senkou Span B lines are lines of the Ichimoku indicator transferred to the hourly timeframe from the 4-hour one.
Support and resistance areas are areas from which the price has repeatedly rebounded off.
Yellow lines are trend lines, trend channels and any other technical patterns.
*The market analysis posted here is meant to increase your awareness, but not to give instructions to make a trade.
If you have an interest in any area of Forex Trading, this is where you want to be.
Global Fx Trading Group is a world leader in providing Fx services to individual traders, including: Unmatched funding programs, on-line education, virtual trading rooms, automation tools, robot building, and personal coaching.
The company was first established by Jeff Wecker, former member of the Chicago Board of Trade, with 25 years in the industry. Jeff has a keen understanding of the needs of Forex traders and those needs are our focus.
Please join our VIP Group while is still FREE …
https://t.me/joinchat/JqsXFBKpyj3YS4bLWzT_rg
Our mission is simple: To enhance as many lives as we can through education and empowerment.
#theforexarmy #forexsigns #forexsignals #forexfamily #forexgroup #forexhelp #forexcourse #forextrade #forexdaily #forexmoney #forexentourage #forextrading #forex #forexhelptrading #forexscalping #babypips #forexfactory #forexlife #forextrader #financialfreedom

